Present Diagnostics in PagerDuty
In this section, we will execute send the diagnostics that were retrieved from CloudWatch Logs to the PagerDuty Incident.
For this workshop, you will trigger the diagnostics manually - though in practice the automation would be invoked by integrating with Automation Actions
or Event Orchestration. However, these topics are beyond the scope of this workshop.
Generate PagerDuty API Token
In the PagerDuty web app:
- Navigate to Integrations -> API Access Keys and click Create New API Key.
- Enter a Description that will help you identify the key later on. If you would like it to be read-only, check the Read-only option.
- Click Create Key.
- A unique API key will be generated. Copy it to a safe place, as you will not have access to copy this key again. Once it has been copied, click Close.
- If you lose a key you will need to delete it and create a new one.
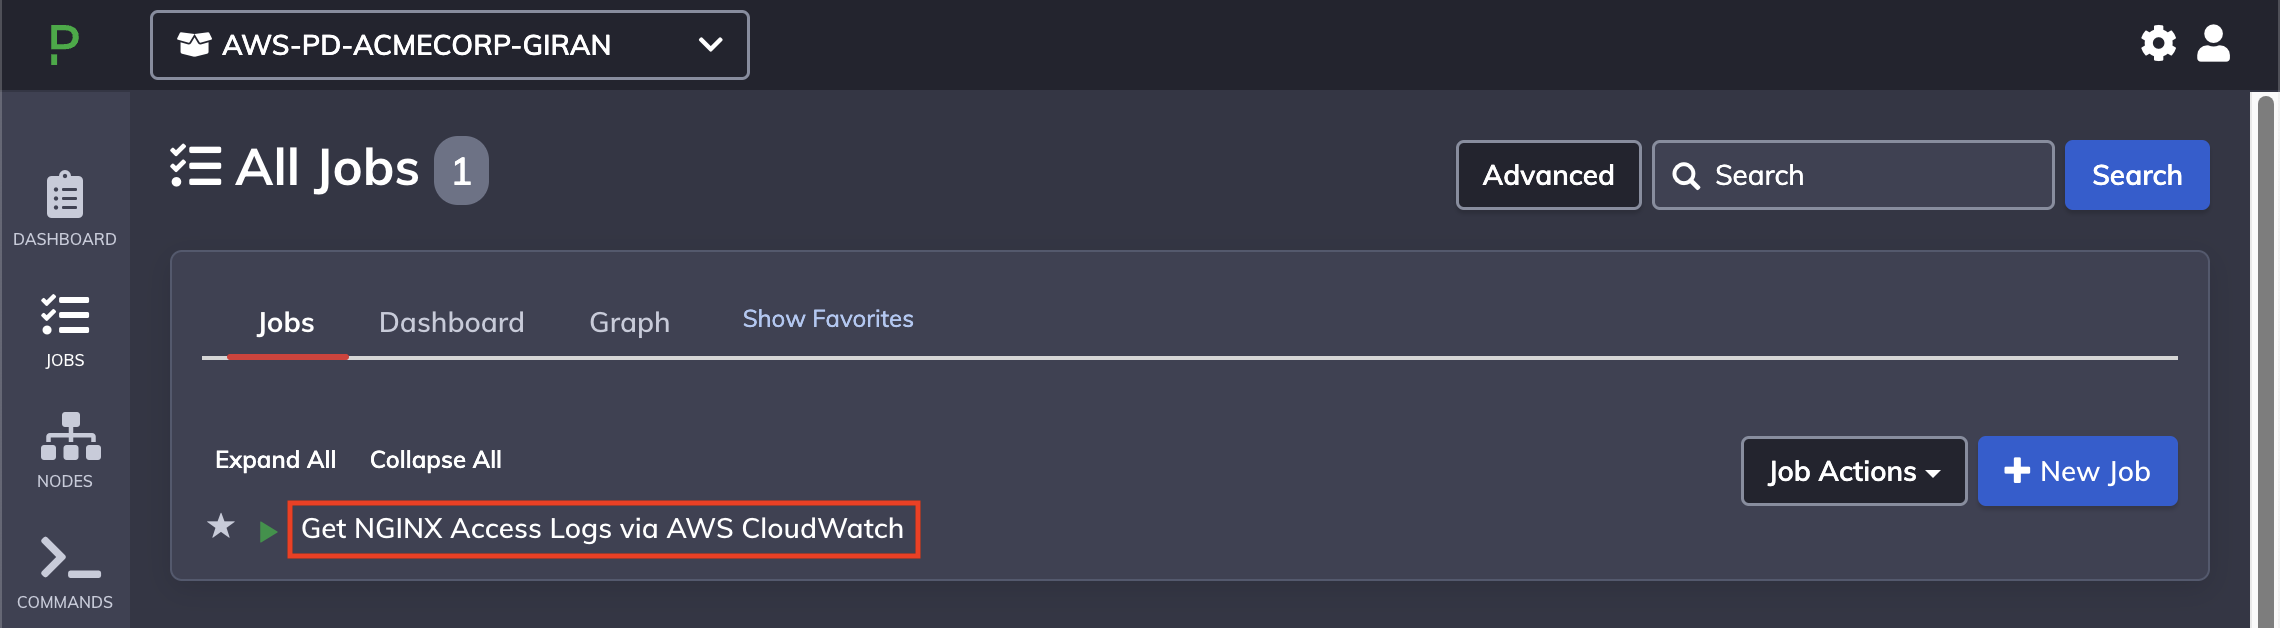
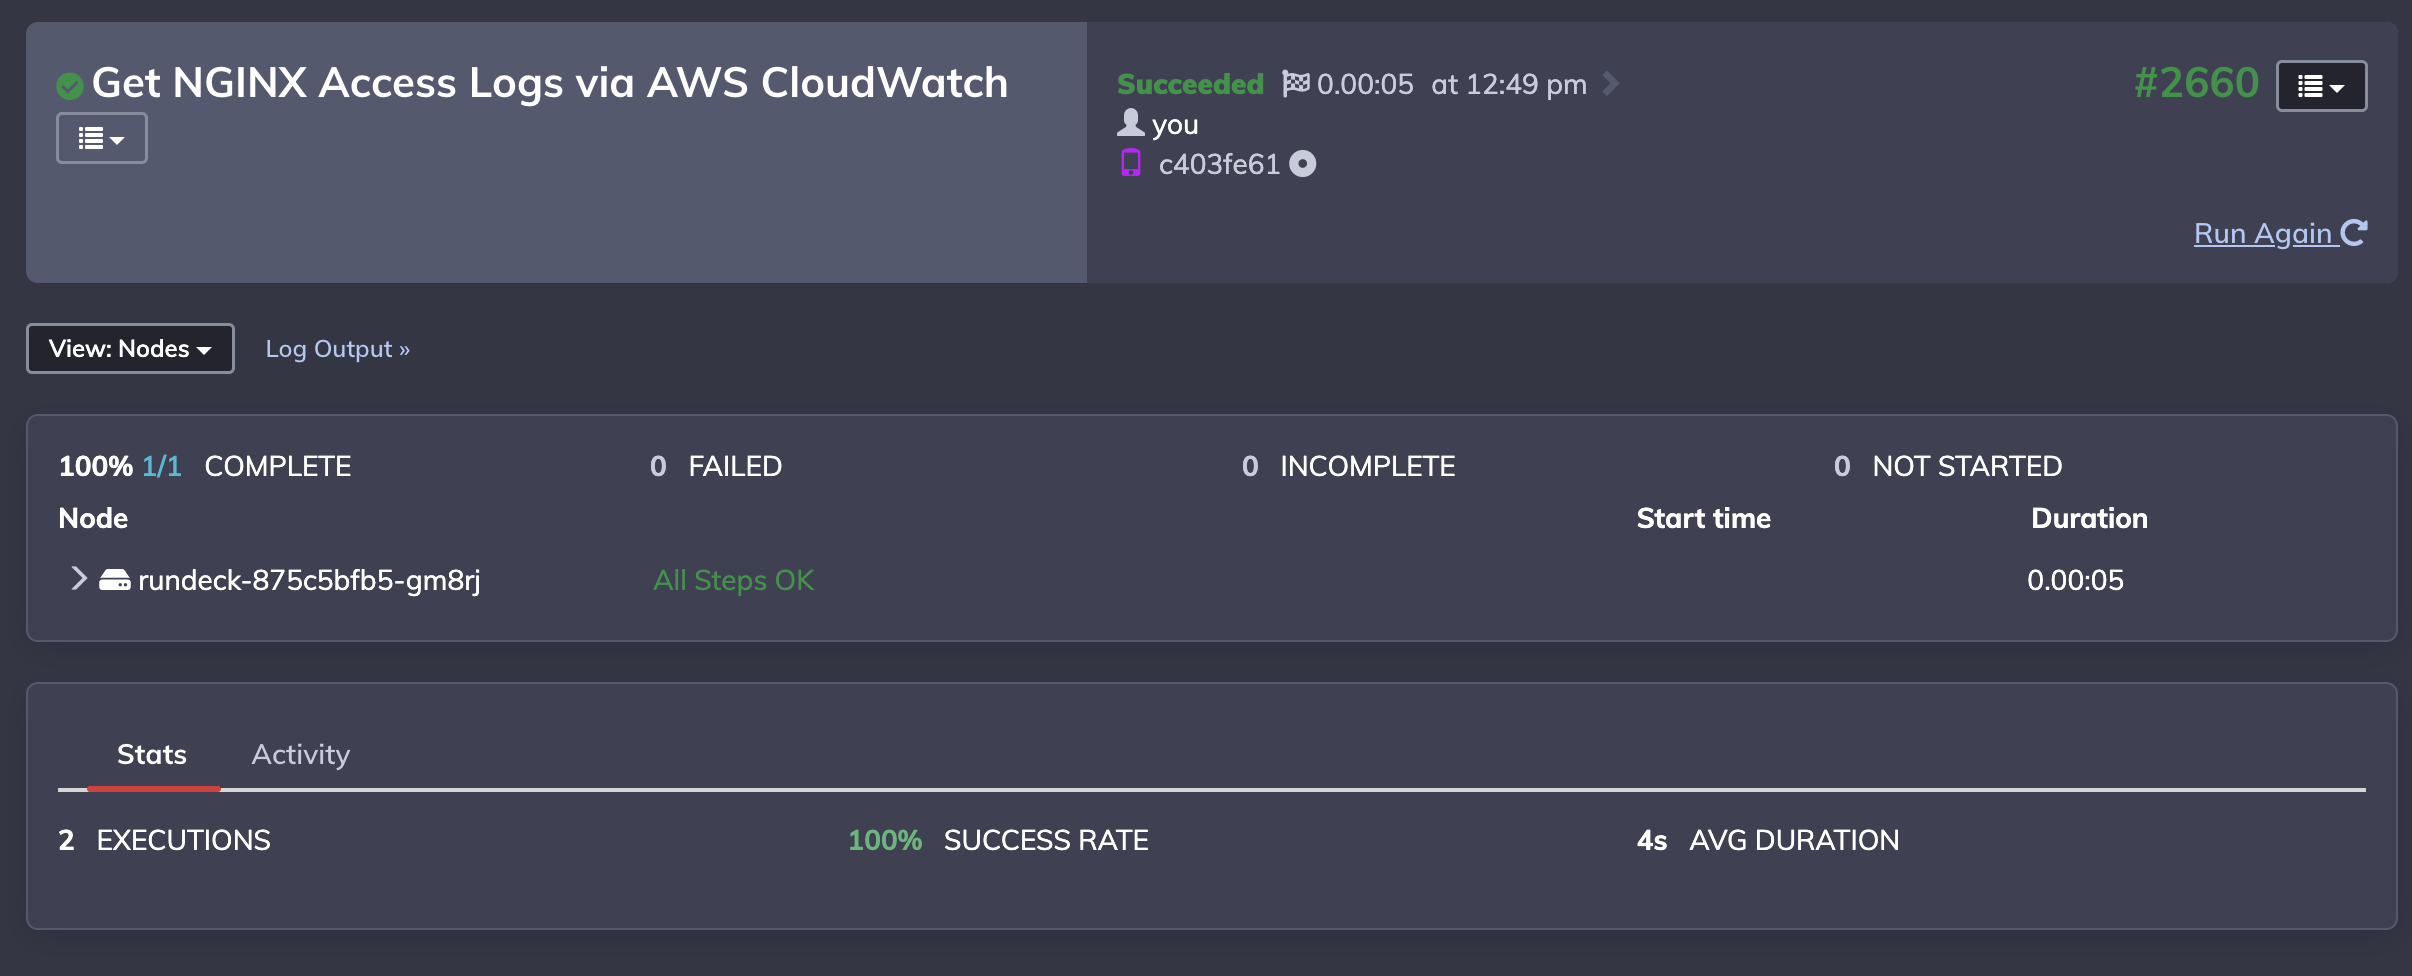
Navigate to the Jobs tab in Runbook Automation and click on “Get NGINX Access Logs via AWS CloudWatch” job.
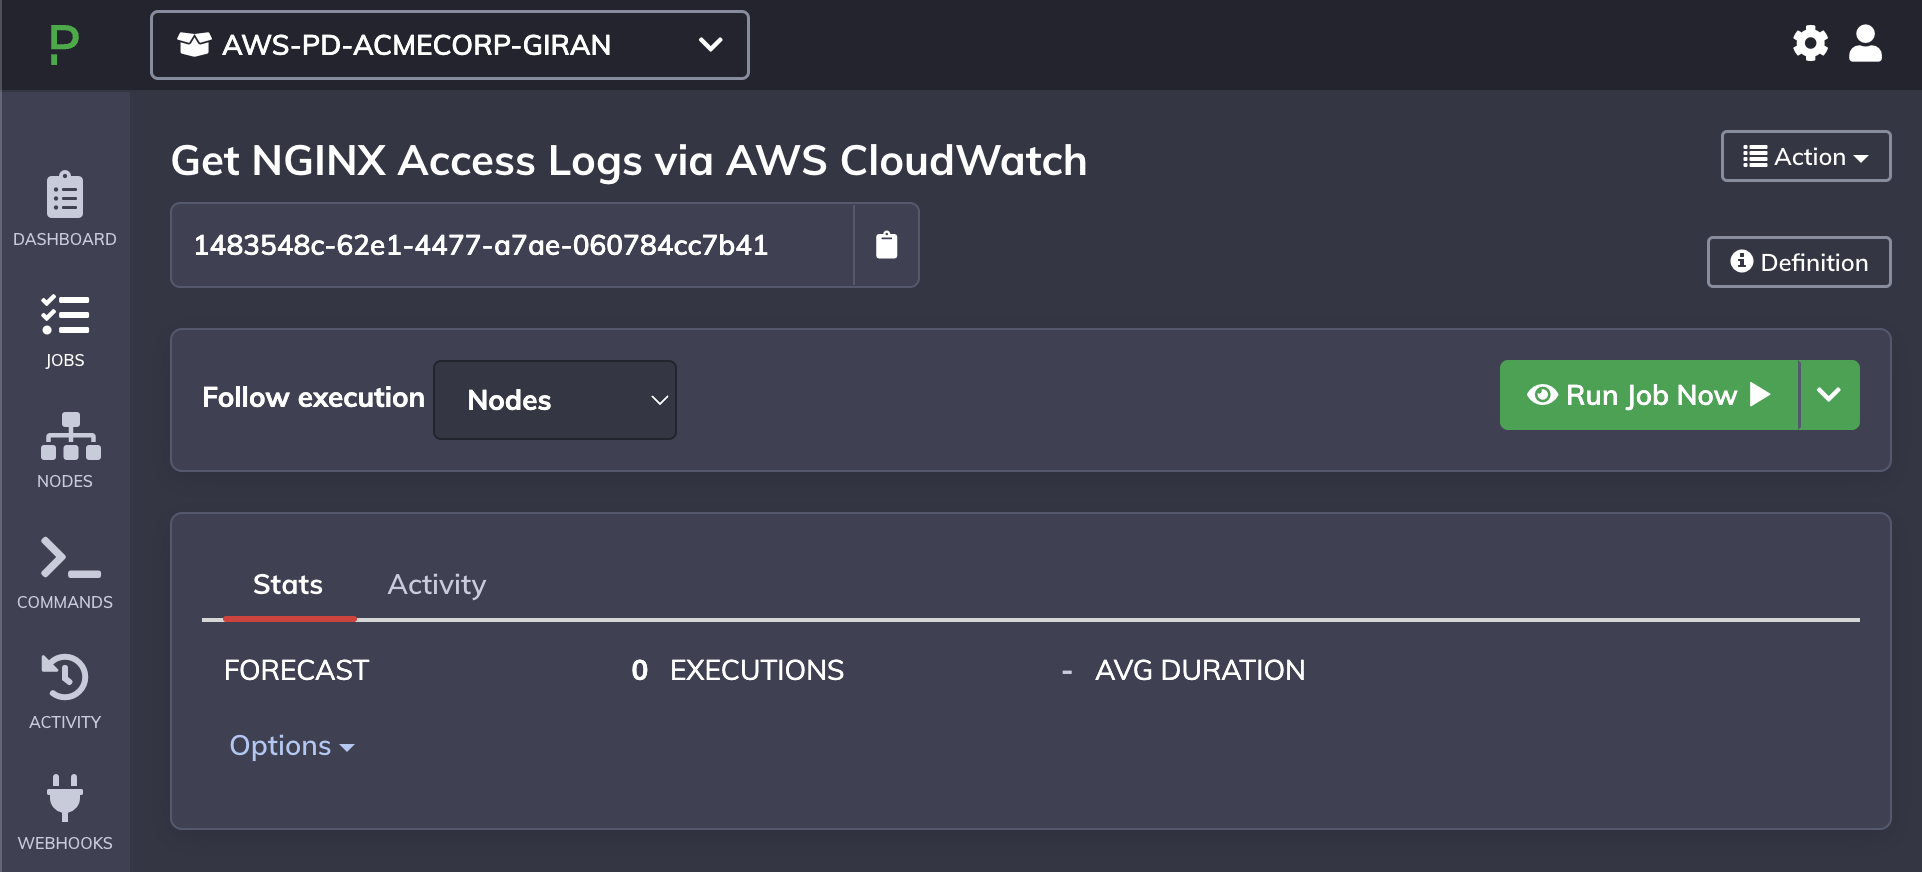
Execute the job by clicking on “Run Job Now”. This will redirect you to the job execution page and will update periodically until the job has completed.
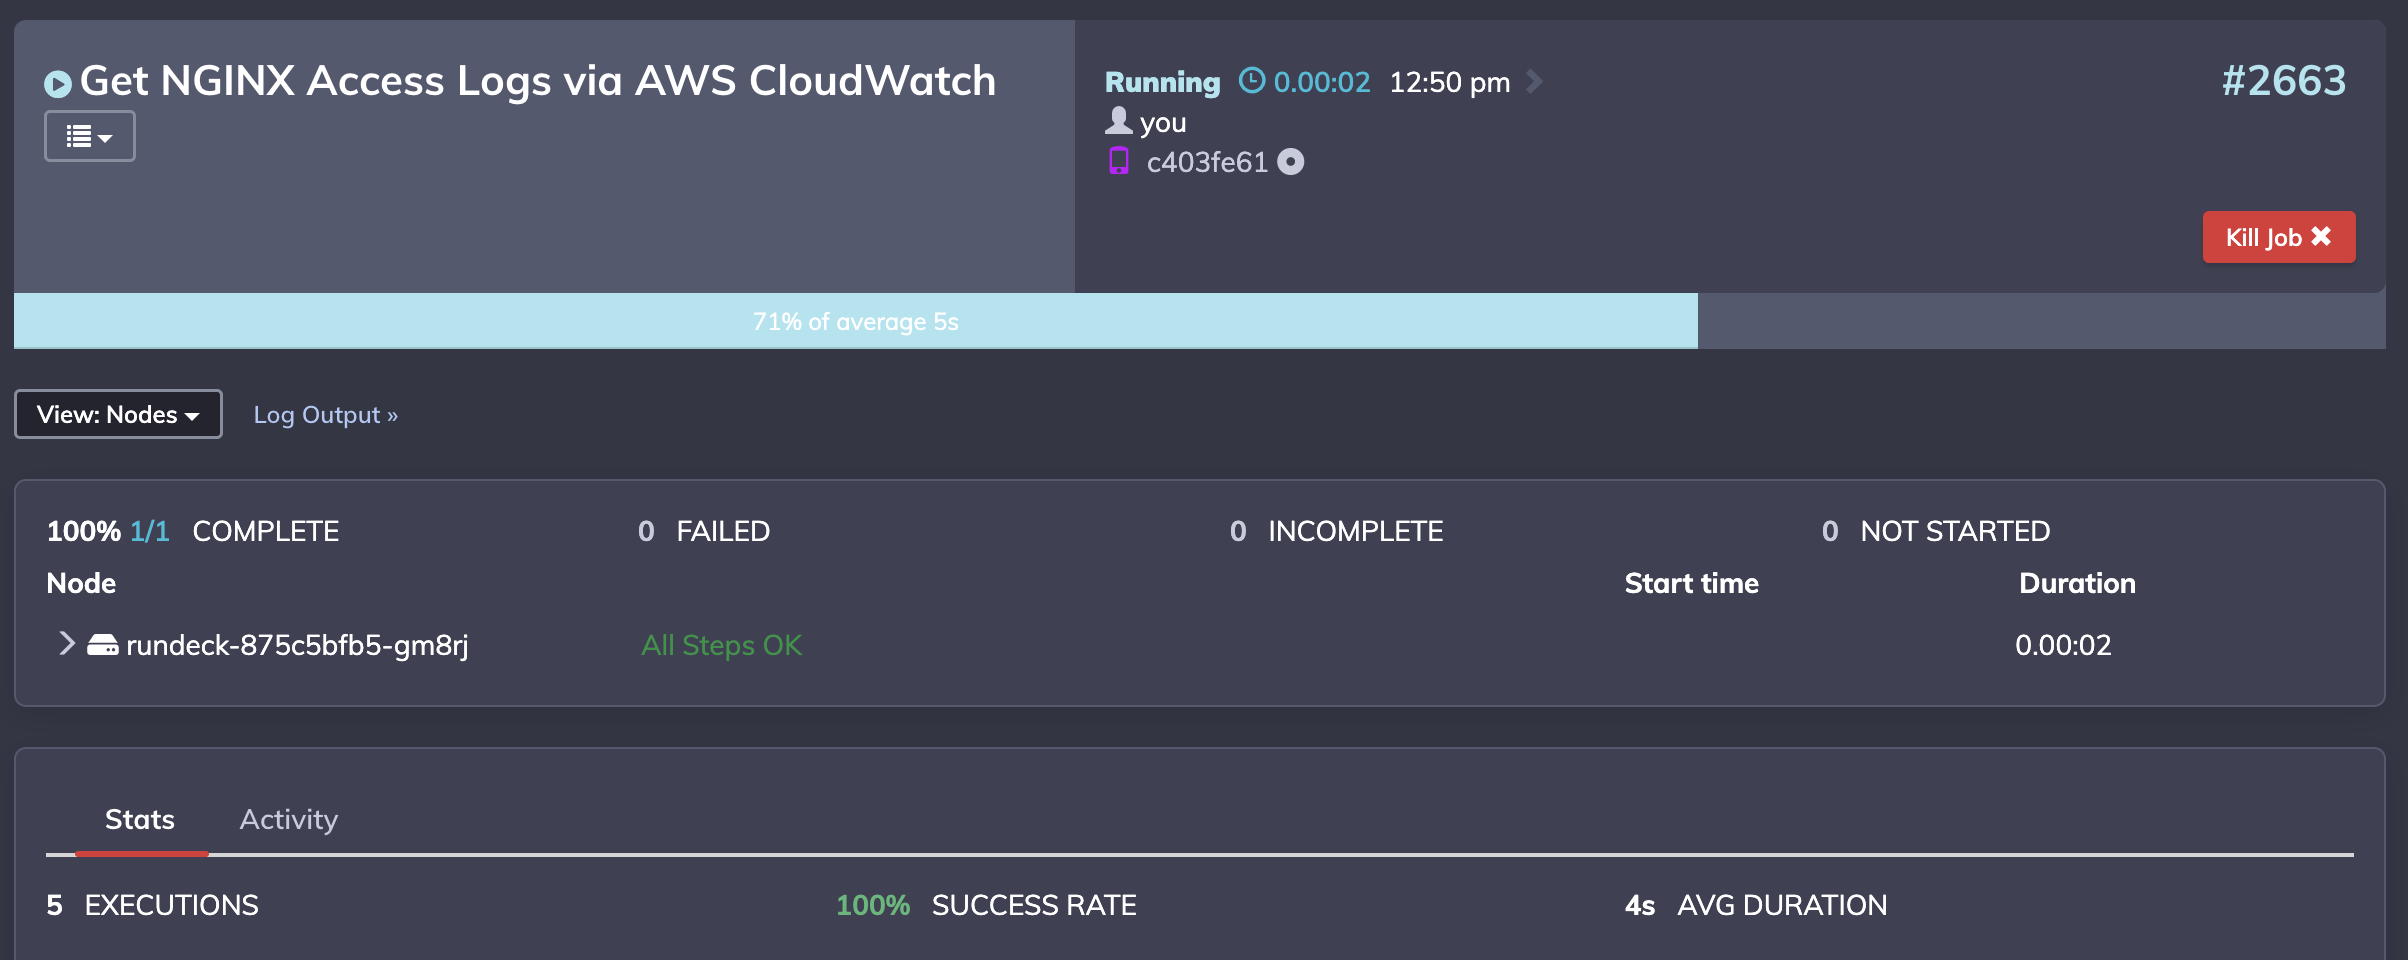
Under the nodes panel, expand the node and job step by clicking on the “>” icons.
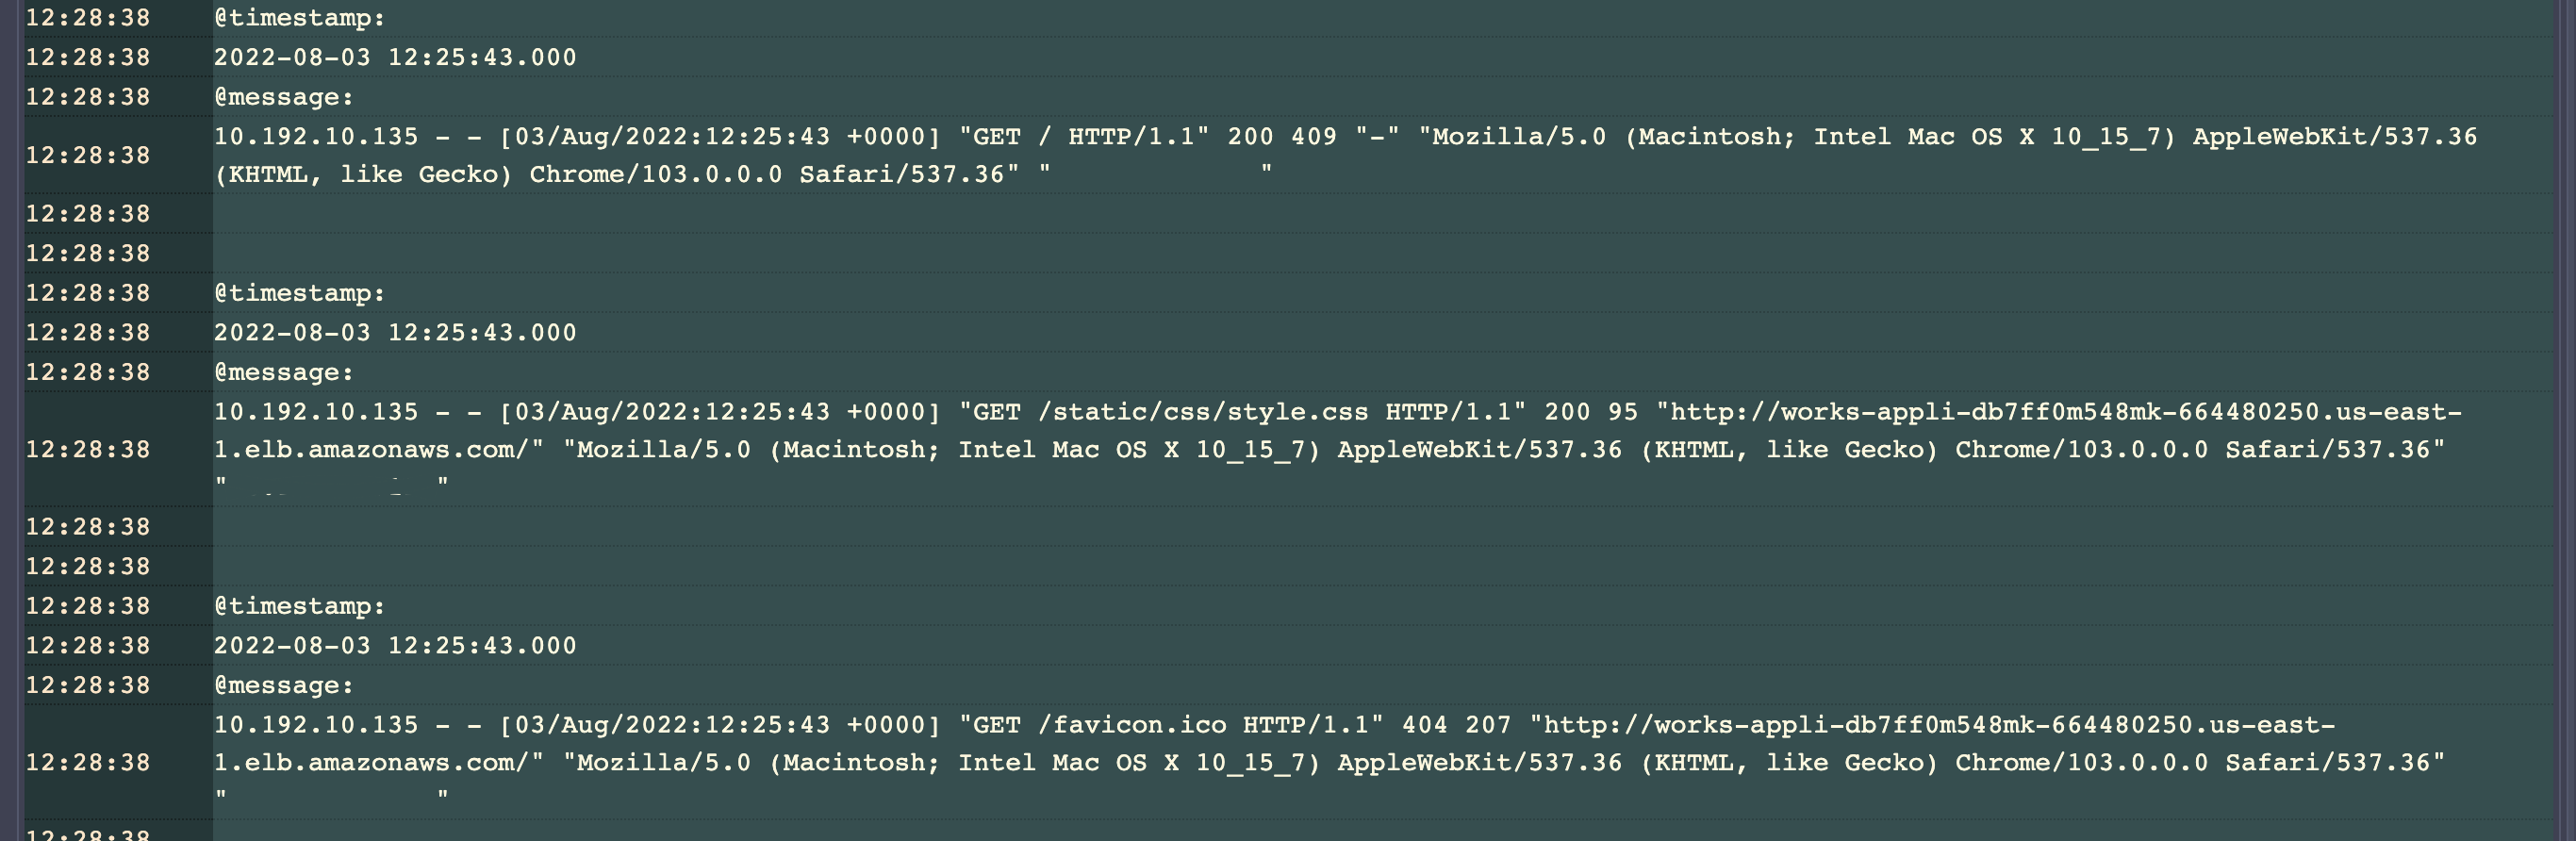
You will then see the stdout of the NGINX logs from CloudWatch.
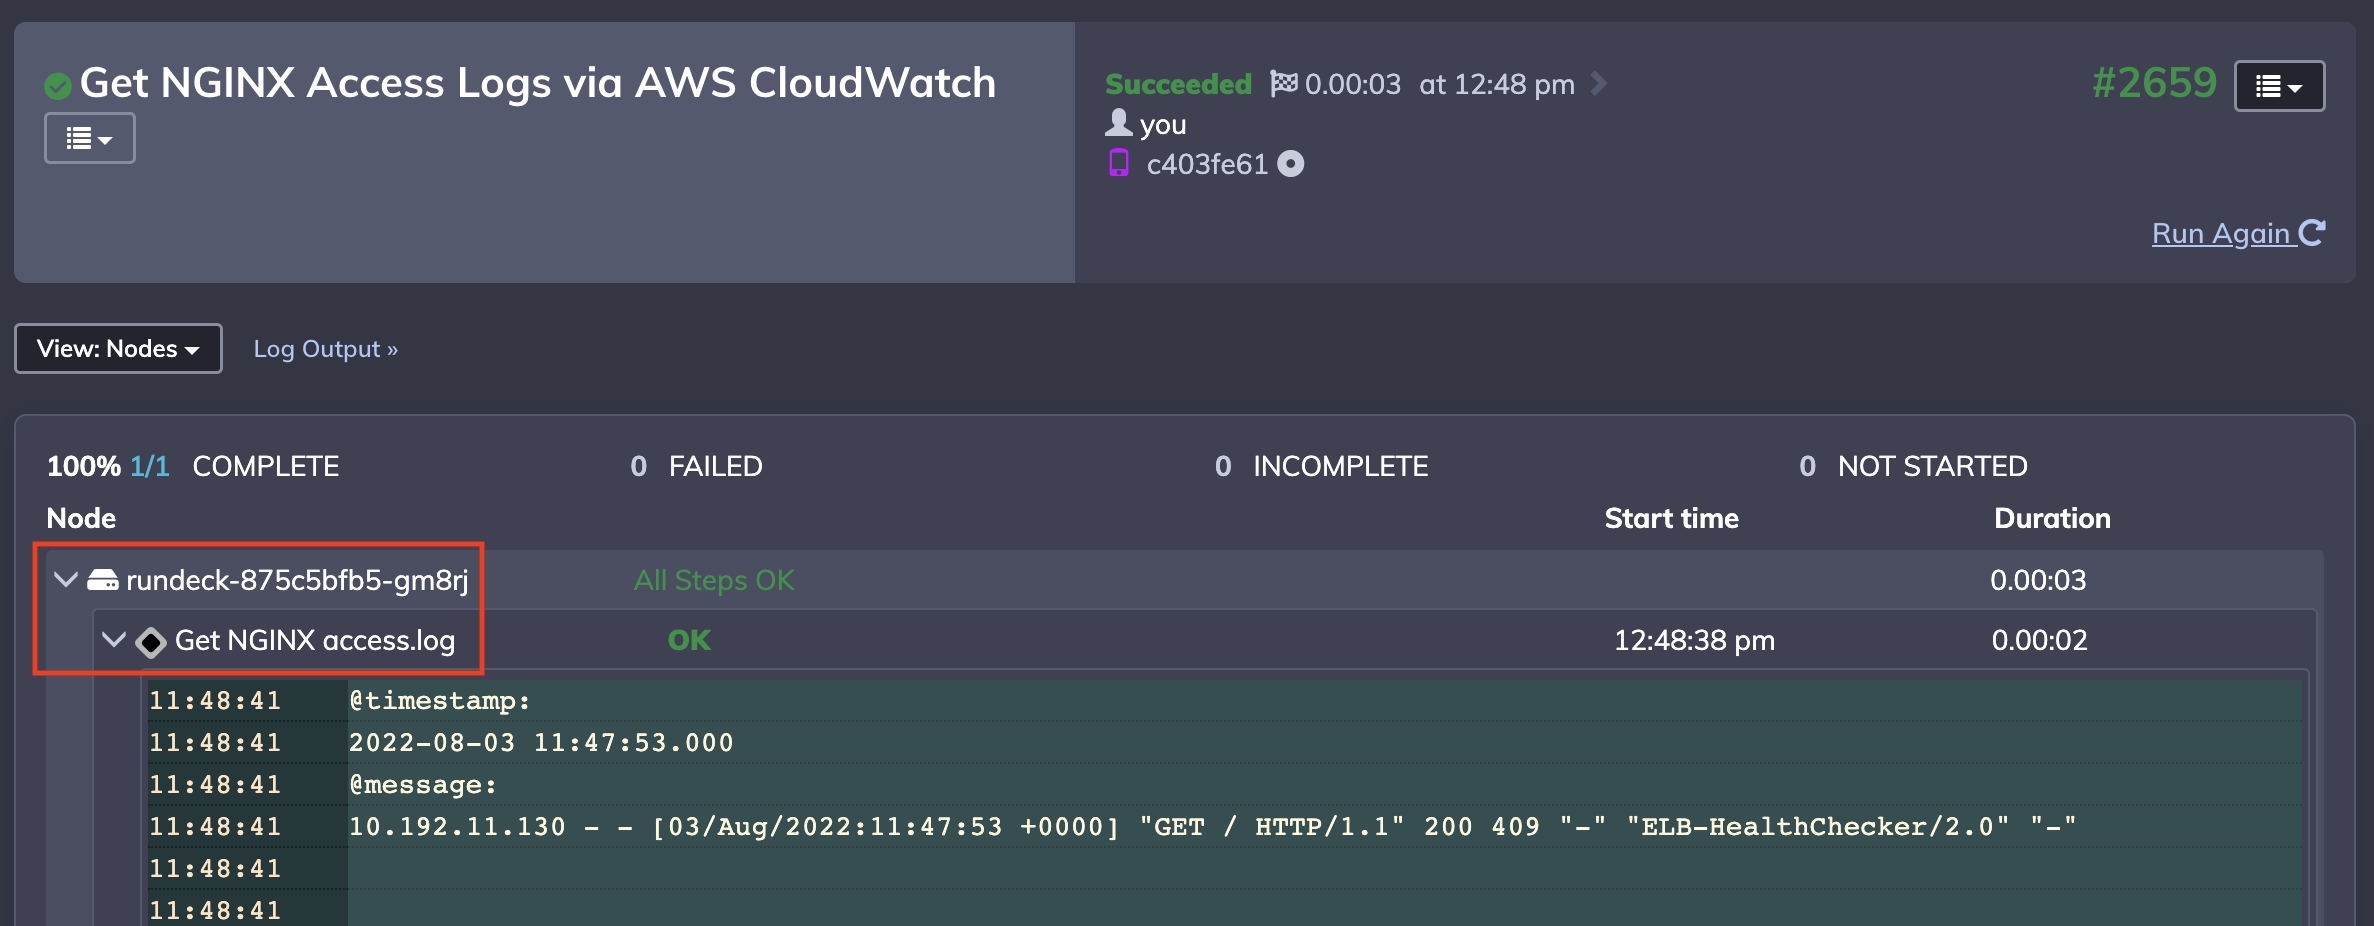
You can further verify the output of these logs by navigating to the URL in the Sample Application CloudFormation output and rerunning the job again.
i.e. you can see access.log updated when a user has accessed the Sample Application in the browser.